55 The three diagrams below each show a supply curve for oil tankers over a relatively short period of time. 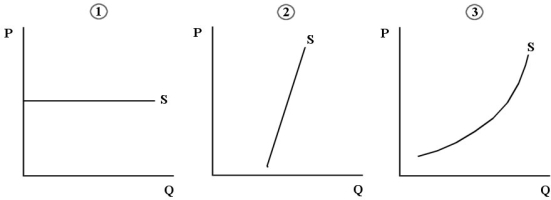 FIGURE 13- 3
-Refer to Figure 13- 3. Consider the supply of oil tankers to an individual Canadian firm, the North American shipping industry, and the world shipping industry. Which diagram best shows the supply of oil tankers that is relevant to the North American shipping industry?
Definitions:
Q18: Private and competitive markets could produce efficient
Q20: A firm's demand for physical capital leads
Q28: Under which of the following circumstances will
Q28: "Rent- seeking" is a problem of<br>A) landlords
Q29: Company A's marketing plan states that it
Q52: One reason an oligopolistic firm may have
Q53: As a seller of labour services, a
Q84: The purpose of a labour union is
Q91: When the marginal costs of pollution abatement
Q104: If at a particular wage rate in