Multiple Choice
The diagram below shows the market demand curve and the cost curves for a single firm. 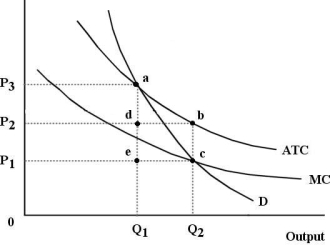 FIGURE 12- 6
-Refer to Figure 12- 6. Suppose the firm is being regulated using a policy of average- cost pricing. The resulting price and output would be
Definitions:
Related Questions
Q3: Consider a monopsonistic labour market. Ten units
Q14: Which of the following statements concerning benefit-
Q31: A barter system of exchange<br>A) requires the
Q40: If there is always a three- for-
Q64: A legislated minimum wage is said to
Q69: Allocative efficiency occurs when<br>A) the sum of
Q74: In terms of human capital, which of
Q80: One reason that national defence is a
Q103: Prior to the 1986 amendments to the
Q104: For a production process that involves a