Multiple Choice
The diagram below shows the market demand curve and the cost curves for a single firm. 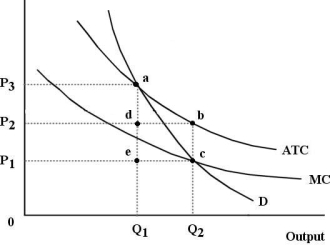 FIGURE 12- 6
-Refer to Figure 12- 6. Suppose this firm is being regulated using a policy of average- cost pricing. In this case, economic profits to the firm are represented by the area
Definitions:
Related Questions
Q36: Marketing plans are often viewed as .<br>A)
Q46: Refer to Figure 13- 4. The total
Q52: Refer to Figure 10- 2. For a
Q54: Refer to Table 11- 3. The Nash
Q67: A monopolistically competitive firm maximizes profits in
Q75: In the Canadian economy, most decisions regarding
Q78: In the pricing section of his marketing
Q82: Which of the following is the definition
Q92: Refer to Figure 11- 4. What is
Q112: Suppose a cook at a diamond mining