Multiple Choice
The diagram below shows the demand and supply curves in a perfectly competitive market. 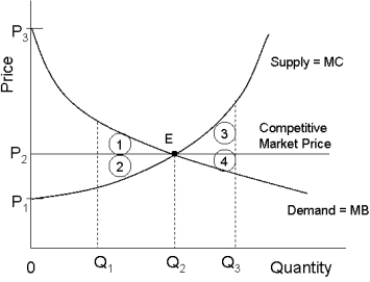 FIGURE 12- 5
-Refer to Figure 12- 5. In the free- market equilibrium, producer surplus is shown by the area
Definitions:
Related Questions
Q28: "Rent- seeking" is a problem of<br>A) landlords
Q34: In Canada, the Competition Act specifies that
Q55: Labour- market discrimination results in a<br>A) lower
Q60: Apple's iPod brand has a relatively large
Q75: Refer to Figure 10- 4. The average
Q84: The purpose of a labour union is
Q86: Refer to Figure 13- 3. Consider the
Q100: If some income earned by households is
Q102: An oligopolistic firm often detects a change
Q109: Consider a monopolist that is able to