The diagram below shows two production possibilities boundaries for Country X. 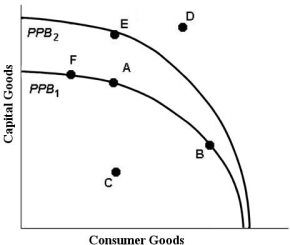 FIGURE 1- 3
-Refer to Figure 1- 3. Growth in the country's productive capacity is illustrated by
Definitions:
Wage Ratio
The comparative rate of pay for different jobs or workers, often analyzed to assess equity or disparity in employment income.
Discriminating Firms
Companies that differentiate their product or service offerings and pricing strategies to cater to different consumer segments or markets.
Production Costs
Production Costs are the expenses directly tied to the creation of goods or services, including materials, labor, and overhead costs.
Nondiscriminating Firms
Businesses that offer the same terms, conditions, and prices to all customers without any form of prejudice or favoritism.
Q2: A Lorenz curve shows the<br>A) level of
Q26: is defined as the trade-off of the
Q30: In the attribute based approach, the customer
Q51: Sam's Sandwich Shack recently conducted two focus
Q56: Refer to Figure 12- 6. Suppose this
Q63: The STP section of a marketing plan
Q65: Suppose drought destroys many millions of acres
Q71: In long- run equilibrium, a monopolistically competitive
Q83: CRM databases contain the following information: customer
Q90: Scoring models are traditionally comprised of three