The figure below shows the relationship of the quantity demanded for iTune music downloads per day to the price of each iTune music download. 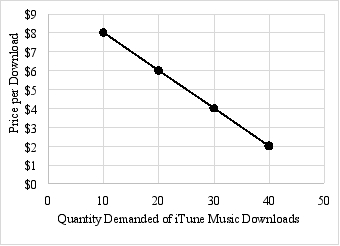 (A) If the price of iTune music dommlaats increases fram 12 per dommaad to 14 per domidaad by how much will the quantity demanded for iTune music dowrloads change?
(B) Eolnan how yaur anser in part (A) relies on the ceteris paribm assumption.
Definitions:
This Firm
A term often used in economic models or discussions to represent a generic company or business under analysis.
Economic Profit
The difference between a firm's total revenues and its total costs, including both explicit and implicit costs.
Opportunity Costs
The penalty of not opting for the next superior alternative while making a decision.
Total Revenues
The total amount of income generated by the sale of goods or services related to the company's primary operations.
Q30: The criteria for joining the EMU was
Q30: Recessions in the United States have become
Q38: The most recent recession officially started in<br>A)
Q52: What is economic growth theory? What does
Q53: Studying economics will provide you with tools
Q57: Knowledge of economics will help you make
Q74: Which of the following is a characteristic
Q85: Suppose that, as the price of product
Q89: Throughout much of U.S. history, tariffs had
Q116: Identify whether the following statements are positive