The figure below shows the effect of a 2011 increase in government purchases on the hypothetical path of real GDP compared to the path of potential GDP (the baseline) between 2011 and 2016. 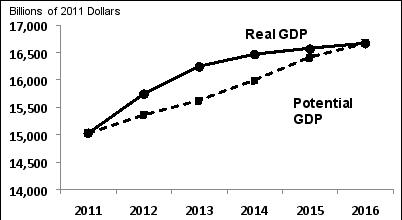 Potential
GDP (A) Using the cirve and line anglysis, expleng what is accurting between 2011 ant
(B) Using the curve and line analysis, exglain what is accurring between 2012 ant 2014 .
(C) Using the curve and line malysis, exglanin what is accuring between 2014 and 2016
Definitions:
Q28: If the Fed has fixed the interest
Q28: There are obvious incentives to overcome adverse
Q29: To simplify the analysis, the textbook assumes
Q55: According to the data in Exhibit 27-1,<br>A)
Q60: When the unemployment rate is equal to
Q81: Explain why the interest rate is the
Q102: The aggregate demand curve depends on the
Q149: Sketch the 45-degree line and the expenditure
Q150: Suppose there is a sharp decline in
Q152: The marginal propensity to consume is best