The figure below plots real and potential GDP between 1971 and 1977. Given the data in the corresponding table, can changes in the rate of inflation over this period be explained by the percent deviation between real and potential GDP? Do these data support or refute the validity of the assumptions about the IA line? 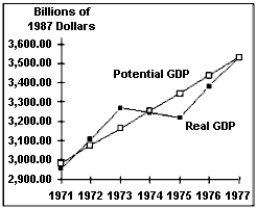
Definitions:
Balance Of Trade
The difference in value between a country's imports and exports over a certain period.
Gross Domestic Product
GDP is the total monetary or market value of all the finished goods and services produced within a country's borders in a specific time period.
Intermediate Goods
Products used in the production process to make other goods, but are not part of the final product.
Double Counting
The mistake of including both the value of intermediate products and the value of final products in calculating gross domestic product; counting the same production more than once
Q2: In some situations,a police officer is authorized
Q24: Over the past 25 years, price shocks
Q58: Suppose the government surplus is currently .5
Q73: What is meant by the term stagflation?
Q79: Under a barter system,<br>A) there is a
Q94: The aim of countercyclical fiscal policy is
Q100: The target inflation rate for many central
Q108: If the central bank changes its monetary
Q127: Suppose government purchases have decreased and the
Q130: The intersection of the inflation adjustment line