Multiple Choice
Figure 8-1
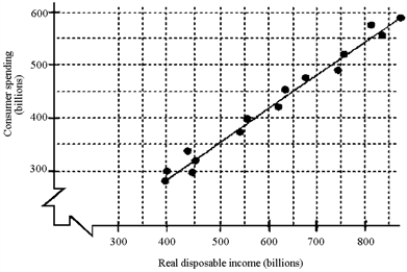
-Based on the scatter diagram in Figure 8-1, approximately how much will consumption increase after a permanent tax cut of $400 billion?
Definitions:
Related Questions
Q21: Which of the following would be associated
Q27: On a graph with time on the
Q34: The combination of high unemployment and high
Q43: The main reason that firms adjust their
Q75: Investment spending is a leakage from the
Q133: In the basic 45-degree line model,what is
Q136: As a result of the war in
Q150: The oversimplified multiplier formula assumes that the<br>A)
Q197: Which of the following groups would have
Q202: In a simple economy (no government sector),the