Multiple Choice
Figure 8-1
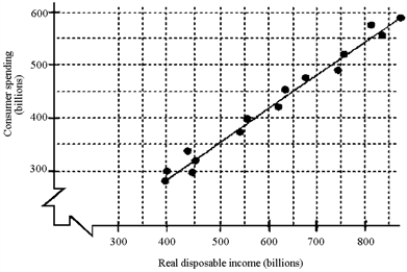
-Based on the scatter diagram in Figure 8-1, if real disposable income is $800 billion, the consumption spending would be approximately
Definitions:
Related Questions
Q2: When various firms fail because their output
Q23: There is now general agreement among economists
Q56: The U.S.government attempts to spur research and
Q68: Most older persons regularly spend more than
Q77: In Figure 10-3,we would expect the aggregate
Q163: A consequence of an inflationary gap is
Q166: If total spending is greater than the
Q179: Stagflation is the conjunction of<br>A) stagnation and
Q184: To calculate a firm's per unit of
Q208: Why is it true that domestic product