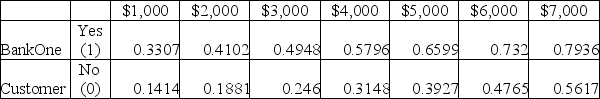
The chart provided shows the probability that a customer will use a coupon offered in a local paper by Lucky Shirts Store. Define the two dependent variables in this chart. How would you determine the odds of a BankOne customer, using the coupon if they annually spend $2,000 at the Store?
Annual Spending at Lucky Shirts Store
Definitions:
Q13: The _ units are the entities (objects,
Q28: Which of the following is an example
Q36: A data set with 7 observations yielded
Q39: A simple index is computed by using
Q43: In a neural network model, the _
Q46: The strength of the relationship between two
Q52: When the moving average method is used
Q58: The quality control manager for NKA Inc.
Q64: An international economist believes that there is
Q77: Box-Jenkins methodology is a more sophisticated approach