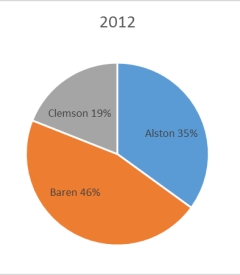
The 2010 and 2012 market share data of three competitors (Alston, Baren, and Clemson) in an oligopolistic industry are presented in the following pie charts.Total sales for this industry were $1.5 billion in 2010 and $1.8 billion in 2012.Clemson's sales in 2010 were ___________. 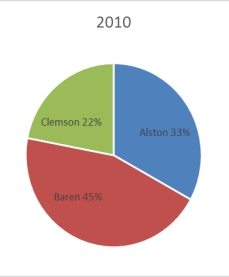
Definitions:
Transfer Pricing Policy
A set of regulations and procedures that multinational companies use to set prices for transactions between their different legal entities.
Vertical Integration
Organizational form in which a firm contains several divisions, with some producing parts and components that others use to produce finished products.
Monopoly Seller
A business entity that is the sole provider of a particular good or service, giving it significant control over the market price.
Marginal Cost Curve
A graphical representation showing how the cost of producing one additional unit of a good or service varies with the quantity produced.
Q5: The following time-series data shows the
Q6: Something to prepare ahead of time and
Q9: To ask whether the applicant's work records
Q18: Which is not a primary goal of
Q29: A standard normal distribution has a mean
Q30: A standard normal distribution has the following
Q32: Participation in a regular program of this
Q34: The sample standard deviation is calculated by
Q42: The area to the left of the
Q46: To be deprived;without;having to do without or