Refer to the information provided in Figure 6.13 below to answer the question(s) that follow. 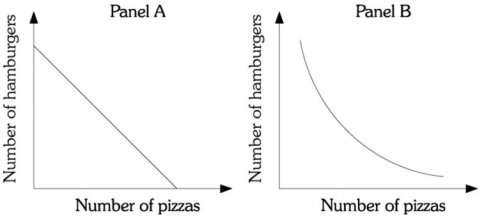
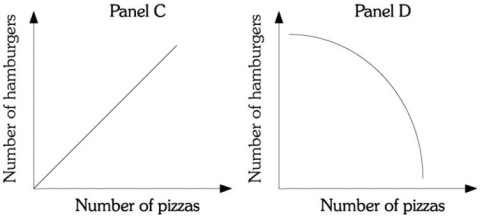 Figure 6.13
-Refer to Figure 6.13. Assume Megan has two products available, pizza and hamburgers. Megan must be compensated with more hamburgers as she gives up more pizzas. The curve in Panel ________ represents her indifference curve.
Definitions:
Correlation Coefficient
A statistical measure that calculates the strength and direction of a linear relationship between two variables, ranging from -1 to +1.
Continuous
Refers to a type of variable or data that can take an infinite number of values within a given range.
Pearson's Correlation Coefficient
A measure of the strength and direction of a linear relationship between two continuous variables, computed as the covariance of the variables divided by the product of their standard deviations.
Ordinal
A term referring to a type of data or a scale of measurement where items are ranked in order but the differences between rank positions are not necessarily equidistant.
Q24: If the quantity of peanut butter demanded
Q39: Refer to Figure 3.2. Which of the
Q60: When the price of tea decreases 7%,
Q61: Demand for one item goes down when
Q63: Refer to Table 6.3. Assume that a
Q83: Refer to Figure 7.8. The firm is
Q143: Goods are allocated in a market system
Q145: When demand is unit elastic, an increase
Q200: Demand curves are derived while holding constant<br>A)
Q271: Refer to Table 6.3. The marginal utility