Refer to the information provided in Figure 6.1 below to answer the question(s) that follow. 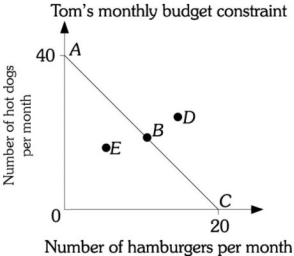 Figure 6.1
-Refer to Figure 6.1. Assume Tom is on budget constraint AC and the price of a hamburger is $8.00. Tom's monthly income is
Definitions:
Cash Flows
The total amount of money being transferred into and out of a business, especially as affecting liquidity.
Probability-Weighted
An approach to forecast future outcomes which involves assigning probabilities to different possible events and calculating expected values.
Time Value
The concept that money available now is worth more than the same amount in the future due to its potential earning capacity.
Par Value
The nominal or face value of a bond, share of stock, or coupon as indicated on a bond or stock certificate. It is the value at which a company's shares are initially recorded in its books.
Q8: Refer to Figure 4.2. The market is
Q12: The ABC Computer Company wants to increase
Q63: When supply is fixed or the product
Q73: Ted has $600 a week to spend
Q98: The income elasticity of demand for education
Q133: Related to the Economics in Practice on
Q160: The total cost curve for a firm
Q164: Refer to Figure 7.9. The firm's isocost
Q164: Refer to Figure 4.3. The government setting
Q254: Ellie is spending her entire income on