Refer to the information provided in Figure 5.7 below to answer the question(s) that follow. 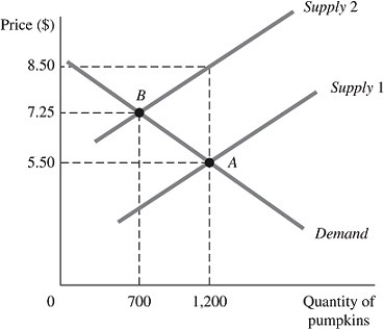 Figure 5.7
The above figure represents the market for pumpkins both before and after the imposition of an excise tax, which is represented by the shift of the supply curve.
-Refer to Figure 5.7. Had the demand for pumpkins been perfectly inelastic at Point A, the amount store owners would have received per pumpkin after the imposition and payment of this tax would have been
Definitions:
Q11: When the slope of a demand curve
Q12: The most common of all nonprice rationing
Q82: If iPods and iTunes are complements, then
Q110: Refer to Figure 3.16. When the economy
Q125: If the price of a normal good
Q188: The All Smiles Greeting Card Company wants
Q208: Refer to Figure 6.6. Bill's budget constraint
Q223: Refer to Figure 6.5. Molly's budget constraint
Q249: For inferior goods, demand will fall when<br>A)
Q267: The slope of the _ is -MP<sub>L</sub>/MP<sub>K</sub>.<br>A)