Refer to the information provided in Figure 5.7 below to answer the question(s) that follow. 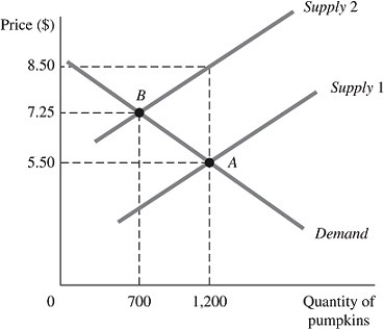 Figure 5.7
The above figure represents the market for pumpkins both before and after the imposition of an excise tax, which is represented by the shift of the supply curve.
-Refer to Figure 5.7. Had the demand for pumpkins been perfectly inelastic at Point A, the price elasticity of demand for pumpkins from the equilibrium point before the imposition of the tax to the equilibrium point after the imposition of the tax would be
Definitions:
Line Of Credit
A financial arrangement between a lender and a borrower that allows the borrower to draw funds up to a predefined limit as needed.
Operating Cycle
The operating cycle is the duration it takes for a business to convert its inventory and other inputs into cash through sales, encompassing the production and sales process.
Accounts Receivable Turnover
A financial metric that measures how frequently a business can convert its accounts receivable into cash over a specific period.
Inventory Turnover
Inventory turnover is a ratio showing how many times a company's inventory is sold and replaced over a period, indicating the efficiency of inventory management.
Q14: If the supply and demand for a
Q37: Refer to Figure 6.14. If the price
Q54: For a particular product, an effective price
Q55: Refer to Figure 3.7. An increase in
Q83: If a firm wants to increase revenue,
Q113: When demand is inelastic, an increase in
Q125: If the price of a normal good
Q130: A price change would have the smallest
Q243: Refer to Figure 3.16. When the economy
Q252: According to the law of demand, quantity