Consider the following information about production of wine and food in England and France: (a) Using the grids below, plot each country's production possibilities curve. 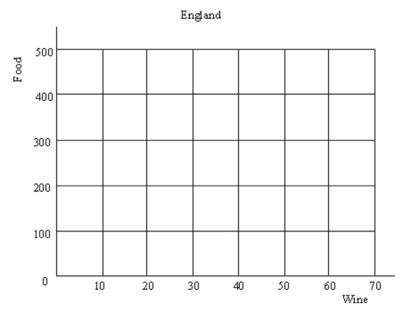
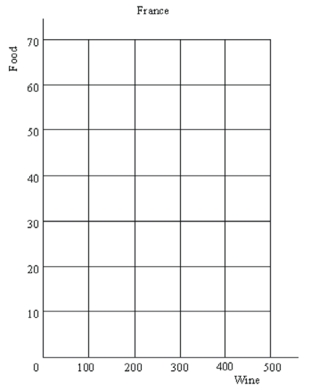 (b) Which country has a comparative advantage in the production of food? Of wine? Explain.
(c) Suppose that currently England and France are not trading with each other. England is producing (and consuming) 200 tons of food and 30 gallons of wine. France is producing (and consuming) 30 tons of food and 200 gallons of wine. As an international trader, how could you take advantage of this situation and make the big bucks?
Definitions:
Addition
The mathematical operation that combines two or more quantities into a single sum.
Commutative Property
A fundamental property of addition and multiplication that states the order of the operands does not change the result, expressed as a+b=b+a or ab=ba.
Multiplication
An arithmetic operation where a number is added to itself a certain number of times, based on another number.
Additive Inverse
The additive inverse of a number is another number that, when added to it, results in zero.
Q1: What will happen to total revenue of
Q1: When Williams-Sonoma introduced its first bread baker
Q25: Use the diagram below to compute the
Q27: What are three negative side effects of
Q33: After a hurricane, several gas stations decide
Q38: When Marxist economists look at labor markets,
Q44: Using earnings potential in court cases to
Q51: The primary problem with estimating elasticity of
Q88: The term "ethnic _" refers to the
Q109: Discuss the advantages and disadvantages of two