Refer to the graph shown depicting a perfectly competitive firm. If average variable cost is $3 at quantity 450, points A through E represent the: 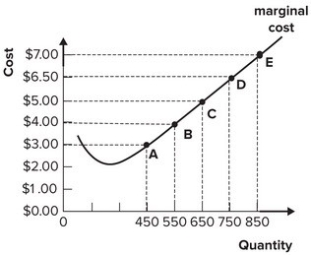
Definitions:
Craft Shop Technology
Techniques and processes used in small-scale production environments, where goods are handcrafted or produced in limited quantities.
Customer Specifications
Detailed descriptions provided by customers outlining the specific requirements, features, or standards that a product or service must meet.
Small-Batch
Production processes characterized by the production of small quantities of goods tailored to specific customer demands or to test new markets.
Supply Chain Management
Strategically links all operations dealing with resource supplies.
Q14: Refer to the graphs shown, which depict
Q19: Long-run competitive equilibrium in an industry implies
Q21: Network externalities exist when:<br>A) set-up costs of
Q45: Quotas on imported automobiles cost jobs in
Q69: Which of the following provides the best
Q75: Refer to the graph shown. If the
Q75: One impact of an import quota is
Q87: Isoquants slope downward because:<br>A) average total costs
Q106: Refer to the graph shown depicting a
Q137: Refer to the graph shown, which depicts