The following graph shows average fixed costs, average variable costs, average total costs, and marginal costs of production. 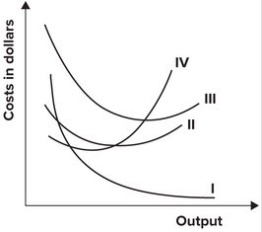 In the graph shown, the marginal cost curve is represented by which curve?
Definitions:
Q12: A British waste management company acquired two
Q26: The United States does not allow U.S.
Q31: Refer to the graph shown. What level
Q40: Refer to the graph shown. If consumers
Q43: Refer to the table shown. <img src="https://d2lvgg3v3hfg70.cloudfront.net/TB7145/.jpg"
Q48: Economists are most likely to suggest that
Q59: The long-run average cost curve is tangent
Q79: Production Possibility Schedules for Two South Pacific
Q123: Refer to the following graph. <img src="https://d2lvgg3v3hfg70.cloudfront.net/TB7145/.jpg"
Q158: Refer to the graph shown. When the