Multiple Choice
Refer to the graph shown. Assume the market is initially in equilibrium at point b in the graph but the imposition of a per-unit tax on this product shifts the supply curve up from S0 to S1. The lost producer surplus of this tax is equal to the area: 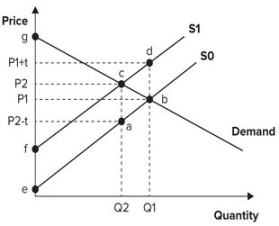
Definitions:
Related Questions
Q10: Average variable cost is total variable cost:<br>A)
Q20: The foreign exchange rate is the rate
Q33: If Americans demand goods produced in Mexico,
Q37: During World War II, the price of
Q57: The Environment Ministry in Japan proposed a
Q77: The following graph shows average fixed costs,
Q123: If the supply curve is perfectly inelastic,
Q141: Along a downward-sloping straight-line demand curve beginning
Q142: If the minimum that the Smith family
Q149: Refer to the graphs shown. If the