Refer to the graph shown. Initially, the market is in equilibrium with price equal to $25 and quantity equal to 100. As a result of a per-unit tax imposed by the government, the supply curve shifts from S0 to S1. The effect of the tax is to: 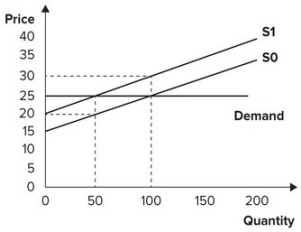
Definitions:
CICA Handbook
The Canadian Institute of Chartered Accountants Handbook, containing standards and guidelines for accounting and auditing practices in Canada.
ASPE
Accounting Standards for Private Enterprises; a set of accounting principles designed specifically for private companies in Canada.
PSAB Recommendations
Advisory statements and guidelines issued by the Public Sector Accounting Board, which influence the accounting and financial reporting practices within the public sector.
Professional Financial Preparers
Individuals with specialized knowledge and skills in preparing financial records and statements in accordance with applicable standards.
Q14: Cross-price elasticity of demand is defined as
Q21: If nations trade on the basis of
Q42: Refer to the graph shown. When the
Q47: Repeated hurricanes in Florida have caused some
Q48: Given the equations for demand and supply:
Q83: Refer to the graph shown. The burden
Q91: There is no deadweight loss if:<br>A) demand
Q100: In 1990 the UN placed trade sanctions
Q107: Refer to the graph shown. When the
Q132: If the demand for agricultural output is