Refer to the graph shown. If the price were at the market equilibrium price, the total surplus would be equal to: 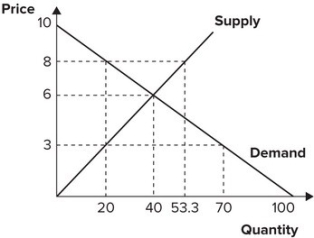
Definitions:
Safety Stocks
Additional quantities of stock kept in inventory to reduce the risk of stockouts caused by variations in supply or demand.
Average Inventory
Average Inventory is a calculation used to estimate the value or quantity of inventory that a business holds over a specific period, often used for analyzing inventory efficiency.
Net Present Value
The difference between the present value of cash inflows and outflows over a period of time, used to assess the profitability of an investment.
Cash Sales Policy
A cash sales policy is a company's strategy to require payment for goods or services at the time of sale, which can improve cash flow and reduce credit risk.
Q10: An economist argues that the states that
Q15: When workers are paid higher wages, production
Q43: Which of the following is not a
Q44: If the world supply curve is S<sub>W1</sub>,
Q49: When an effective price ceiling is removed,
Q93: Refer to the graph shown. Assume that
Q108: Refer to the graph shown. In the
Q111: An economist estimates the elasticity of demand
Q119: Price tends to be in equilibrium where
Q122: Refer to the graphs shown. The market