Refer to the graph shown. Assume the market is initially in equilibrium at point b in the graph but the imposition of a per-unit tax on this product shifts the supply curve up from S0 to S1. The lost consumer surplus of this tax is equal to the area: 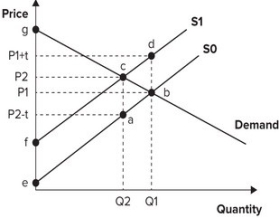
Definitions:
Product Cost Method
An accounting method used to assign costs to inventory and cost of goods sold, including direct materials, direct labor, and manufacturing overhead.
Differential Cost
The difference in total cost between two alternatives in making a business decision.
Differential Revenue
The difference in revenue generated from two different business actions or decisions, helping to assess the financial impact of each choice.
Contribution Margin
The difference between sales revenue and variable costs, used to cover fixed costs and to generate profit.
Q1: An effluent fee is an example of:<br>A)
Q12: The more elastic the supply and the
Q31: A price elasticity of demand for a
Q55: The following table shows four firms,
Q56: Refer to the graph shown. If the
Q59: Refer to the graph shown for a
Q91: There is no deadweight loss if:<br>A) demand
Q103: Refer to the graph shown. <img src="https://d2lvgg3v3hfg70.cloudfront.net/TB7145/.jpg"
Q122: Fishing for king crabs for a living
Q132: An upward-sloping supply curve implies that:<br>A) quantity