Multiple Choice
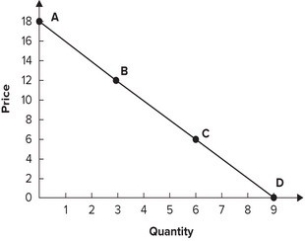
Refer to the graph shown. Calculate the approximate elasticity of demand for the line segment CD: 
Definitions:
Related Questions
Q15: Direct regulation means that government sets specific
Q36: A price floor causes excess demand, resulting
Q49: When an effective price ceiling is removed,
Q52: Refer to the following graph. <img src="https://d2lvgg3v3hfg70.cloudfront.net/TB7145/.jpg"
Q100: In 1990 the UN placed trade sanctions
Q107: Refer to the graph shown. When the
Q124: Refer to the graph shown. When price
Q125: A policy that requires all the people
Q151: Refer to the graph shown. The approximate
Q161: Refer to the following graph. <img src="https://d2lvgg3v3hfg70.cloudfront.net/TB7145/.jpg"