Refer to the following graphs. 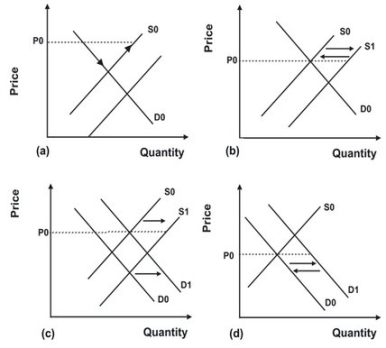 In the early 1990s, mounds of newspapers and worthless plastic piled up at recycling centers. As the nation's economy continued to grow, increased demand eliminated the mounds and turned them into shortages. In the mid-1990s, as recycling became more popular, the mounds of recycled materials returned. What graph best depicts these events on the market for recycled materials?
Definitions:
Raw Materials Inventory
The total cost of all the raw materials that are currently held by a company in stock, awaiting to be used in production.
Gallons
A unit of volume used primarily in the United States for measuring liquids.
Standard Costs
Predetermined costs for manufacturing a product, used for budgeting, cost control, and performance evaluation.
Cash Account
An accounting ledger that tracks the money a company spends (cash out) and receives (cash in).
Q3: Refer to the graph below. <img src="https://d2lvgg3v3hfg70.cloudfront.net/TB7145/.jpg"
Q4: Suppose New Zealand uses one unit of
Q20: A lawyer who drives a beat-up car
Q34: If elasticity of demand is 0.2, elasticity
Q58: Which group has ultimate control over the
Q74: Refer to the graphs shown. The arrow
Q75: Suppose that a negative externality creates $1
Q115: State and local governments do not receive
Q133: Refer to the following graph. <img src="https://d2lvgg3v3hfg70.cloudfront.net/TB7145/.jpg"
Q153: Refer to the graph shown. At which