Refer to the following graph. 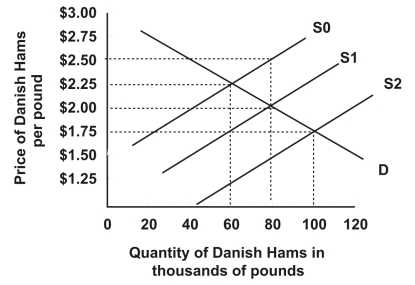 Demand and supply are initially D and S1, respectively. Which of the following best describes the effect of a $0.50 per pound tariff on Danish hams imported into the United States?
Definitions:
ATC Curve
Average Total Cost Curve, a graphic representation that shows the cost per unit of output produced.
Barriers to Entry
Factors that make it difficult for new firms to enter a market, such as high startup costs, stringent regulations, or strong competition from existing firms.
Administered Prices
Prices that are set by the company rather than determined by market demand and supply conditions; often found in less competitive markets.
Cartel
An association of independent businesses or countries agreeing to coordinate their production and pricing to monopolize a market or maximize profits.
Q13: A person who has auto insurance is
Q41: In socialism:<br>A) economic forces do not operate.<br>B)
Q45: The cross-price elasticity of demand is the
Q54: Refer to the graphs shown. The burden
Q69: Governments establish the laws that regulate the
Q79: In economic terminology, a free rider is
Q86: Suppose that a consumer has a health
Q103: Mercantilism was a system in which all
Q106: Refer to the graph shown. Given the
Q121: Which of the following is not one