Multiple Choice
Refer to the graphs shown. The effect of increased consumer income and higher production costs on a normal good is most likely shown in: 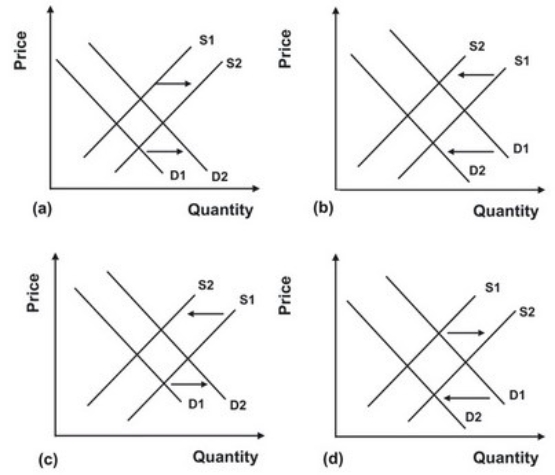
Definitions:
Related Questions
Q7: How does giving money through Kiva differ
Q16: Refer to the following table to
Q30: Refer to the following graph. <img src="https://d2lvgg3v3hfg70.cloudfront.net/TB7145/.jpg"
Q53: Normative economics seeks to:<br>A) determine the most
Q71: Suppose a recent and widely circulated medical
Q76: In the factor market:<br>A) households supply factors
Q90: When computer manufacturers overcame the enormous 13,000
Q101: An economist estimates that with every 15
Q105: Refer to the graph shown. When market
Q144: The following graph shows the supply of