Refer to the graphs shown. 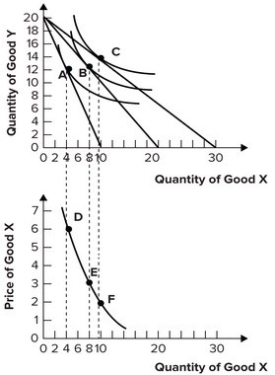 If income is $60 and the price of Y is $3, a decrease in the price of X from $3 to $2 would cause a movement:
Definitions:
Quantity Supplied
The amount of a good or service that producers are willing and able to sell at a given price in a specified period.
Increase in Demand
A situation where there is a rise in the quantity of a product or service that consumers are willing and able to buy at given prices.
Demand Curve
A graphical representation showing the relationship between the price of a good or service and the quantity demanded by consumers over a certain period.
Quantity Demanded
The total amount of a good or service that consumers are willing and able to purchase at a given price in a specified period of time.
Q21: In the North American Industry Classification System
Q22: Experiments based on the "ultimatum game" indicate
Q40: When looking back on past choices, some
Q53: Which of the following will not shift
Q61: A monopsonist will pay a wage that:<br>A)is
Q62: Refer to the graph shown. If a
Q65: Refer to the graph shown. <img src="https://d2lvgg3v3hfg70.cloudfront.net/TB7143/.jpg"
Q83: A firm will spend money on a
Q131: On the Lorenz curve, a perfectly equal
Q143: The following table lists the utility