Multiple Choice
Refer to the graph shown. 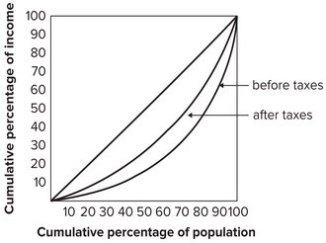 A possible explanation for the difference between the distribution of income before taxes and the distribution of income after taxes shown in the graph is that the tax system:
Definitions:
Related Questions
Q16: When judging the competitiveness of markets by
Q21: Briefly describe the monitoring problem as it
Q39: The three major assumptions underlying the economist's
Q57: Game theory tells how to win at
Q58: The equilibrium solution for the following
Q91: Analyzing each action of a firm on
Q132: If an industry has a Herfindahl index
Q133: Refer to the following graph. <img src="https://d2lvgg3v3hfg70.cloudfront.net/TB7143/.jpg"
Q164: Refer to the graph shown. Given this
Q246: Refer to the graph shown. If this