Multiple Choice
The following graph shows average fixed costs, average variable costs, average total costs, and marginal costs of production. 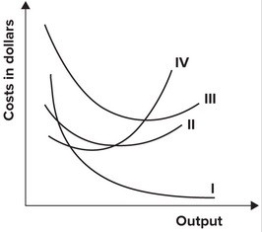 In the graph shown, the marginal cost curve is represented by which curve?
Definitions:
Related Questions
Q2: A free trade association is a group
Q26: Why are the gains from trade often
Q71: An assumption of a competitive market is
Q81: Which of the following is not an
Q87: If your cell phone bill is $40
Q95: Assume that the home construction industry is
Q96: The voluntary export restraints on autos by
Q113: If a program requires people to pay
Q128: The graph shown exhibits constant returns to
Q136: Demonstrate graphically and explain verbally why the