Multiple Choice
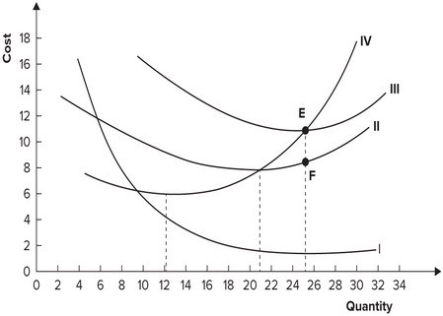
The following graph shows average fixed costs, average variable costs, average total costs, and marginal costs of production.  Average variable cost is minimized when output equals:
Definitions:
Related Questions
Q11: All of the following are justifications for
Q14: In the United States, globalization has caused
Q15: Economists believe that free riders often can
Q58: Externalities can be either positive or negative.
Q71: The United States does not allow U.S.
Q74: Refer to the table shown. Marginal
Q84: Refer to the graph shown. The cheapest
Q146: If your latest test grade and your
Q157: Rachel left her job as a graphic
Q165: Each firm in perfect competition:<br>A)sets quantity based