Refer to the graph shown. Initially, the market is in equilibrium with price equal to $25 and quantity equal to 100. As a result of a per-unit tax imposed by the government, the supply curve shifts from S0 to S1. The effect of the tax is to: 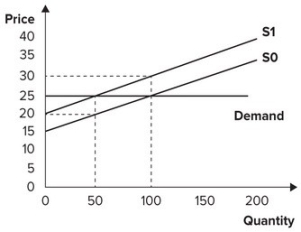
Definitions:
Crowding-Out Effect
The phenomenon where increased government spending leads to a reduction in private sector spending and investment due to higher interest rates or other factors.
Government Spending
The total amount of public expenditure by a government, including spending on defense, education, public infrastructure, and welfare programs.
Private Investment
The expenditure on capital goods by private sector firms or individuals in order to generate future income or profits, excluding government spending.
Crowding-In Effect
An increase in private sector spending stimulated by federal budget deficits financed by U.S. Treasury borrowing.
Q7: Refer to the graph shown. If consumers
Q17: One impact of an import quota is
Q39: If the elasticity of demand for electricity
Q71: Refer to the graph shown. <img src="https://d2lvgg3v3hfg70.cloudfront.net/TB7143/.jpg"
Q109: If elasticity of demand is 0.2, elasticity
Q115: Start by drawing a supply and demand
Q135: Refer to the following graphs. <img src="https://d2lvgg3v3hfg70.cloudfront.net/TB7143/.jpg"
Q150: Congratulations! You have just been promoted
Q191: What are the arguments for and against
Q195: Refer to the graph shown, which shows