Multiple Choice
Refer to the graph shown. An effective price ceiling at $3 causes consumer surplus to: 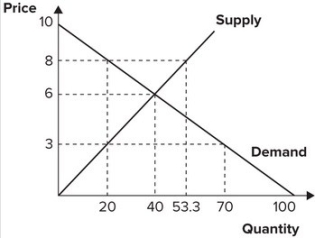
Definitions:
Related Questions
Q10: Refer to the graph shown. Given supply,
Q11: Consider the following information about production
Q43: This table shows the marginal benefits
Q49: An effluent fee is an example of:<br>A)a
Q89: Refer to the graph shown. Assume the
Q100: The cost of running an electrical utility
Q114: Trade sanctions imposed on Iraq that limited
Q135: Refer to the following graphs. <img src="https://d2lvgg3v3hfg70.cloudfront.net/TB7143/.jpg"
Q144: A tariff is:<br>A)a tax that government places
Q187: Repeated hurricanes in Florida have caused some