Refer to the graph shown. The difference between total surplus in equilibrium and total surplus when price is $8.15 and quantity is 220 is: 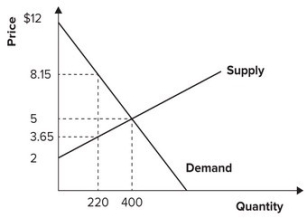
Definitions:
Peak
The transition from the end of an expansion to the start of a contraction.
Business Cycle
The fluctuation in economic activity that an economy experiences over a period, characterized by expansion and contraction phases.
Corporate Tax Rate
The proportion of a company's profits that is owed to the government as tax.
Fixed Costs
Costs that do not change with the level of production or sales, such as rent, salaries, and loan payments.
Q4: Define the price elasticity of demand.
Q13: Demonstrate graphically and explain verbally how the
Q18: Refer to the graph shown. Which of
Q21: New York City has been experiencing a
Q47: Are the elasticities of demand and supply
Q71: Refer to the graph shown. <img src="https://d2lvgg3v3hfg70.cloudfront.net/TB7143/.jpg"
Q85: Refer to the graph shown. Initial market
Q99: Globalization has increased the demand for the
Q179: Refer to the graph shown. After an
Q208: Refer to the graph shown. The elasticity