Multiple Choice
Refer to the graph shown. Assume the market is initially in equilibrium at point j in the graph but the imposition of a per-unit tax on this product shifts the supply curve up from S0 to S1. The welfare loss triangle from this tax is represented by area: 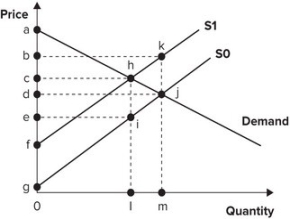
Definitions:
Related Questions
Q16: Start by drawing a supply and demand
Q28: Infant industry protection can be justified in
Q35: Refer to the graph shown. When price
Q70: As the price of tomatoes fell from
Q85: The analysis of international trade suggests that
Q92: Big Construction Company wants to create a
Q97: If government were to issue a fixed
Q110: An economist is most likely to support
Q118: Production Possibility Schedules for Two South
Q151: Suppose that a negative externality creates $1