Multiple Choice
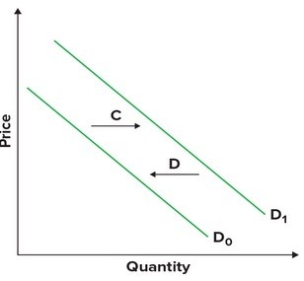
Refer to the graphs shown. If consumers began purchasing more of this product due to a decrease in price, this would be shown by arrow: 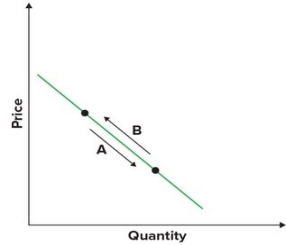
Definitions:
Related Questions
Q5: People can reasonably expect that an economic
Q35: Refer to the table shown that
Q40: Refer to the graph shown. Initially, the
Q61: Does the production possibilities curve tell us
Q73: Use a supply/demand diagram to explain the
Q87: Refer to the graph shown. An effective
Q104: Which of the following is an example
Q106: Refer to the graph shown. Which supply
Q108: Refer to the graph shown. An effective
Q121: In Operation Desert Storm, oil facilities in