Solved
Consider the Following Demand Table and the Graph Which of the Demand Curves Best Reflects the Demand Table
Multiple Choice
Consider the following demand table and the graph. 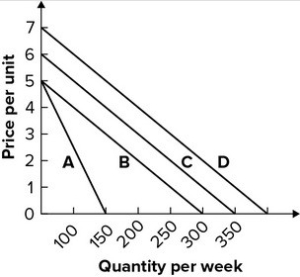 Which of the demand curves best reflects the demand table?
Definitions:
Related Questions
Q7: A primary goal of the International Monetary
Q14: A cultural norm is a(n):<br>A)economic force.<br>B)social force.<br>C)political
Q39: At a price of $3.50, the
Q52: The L3C (low profit limited liability company)type
Q69: Assume the graphs shown reflect the egg
Q72: The point at which the supply curve
Q113: After several years of slow economic growth,
Q145: If consumers won't pay more than $1.50
Q157: Suppose a market has an excess demand
Q198: Refer to the graph shown. Which statement