The diagram below represents the producer side of the market for skateboards in New York.The current price of skateboards is PA.Each of the events described below will have some impact on the supply of skateboards.For each event,draw a picture to illustrate the effect of the event.Be sure to explain your pictures using pertinent economic terminology ("movement along" or "change in quantity"). 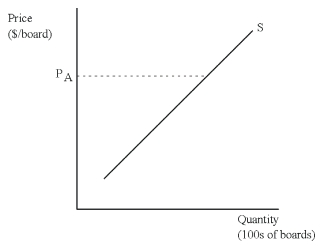 (a)A drop in the price of skateboards.
(b)An increase in the price of wheels used in the manufacturing of skateboards.
Definitions:
Goodness Of Fit Model
A concept in psychology that describes how well an individual's temperament matches the expectations and demands of their environment, impacting their development.
Merchant
An individual or business that sells goods or services in the market.
Article 2
Refers to a portion of the Uniform Commercial Code that deals with the sale of goods.
Provisions
Specific clauses or articles in a contract or legal statute detailing certain conditions, requirements, or stipulations.
Q2: The table below shows the quantity
Q21: New York City has been experiencing a
Q36: The Industrial Revolution was important to the
Q39: Even though 80,000 individuals in the United
Q59: If quantity demanded does not change when
Q65: Refer to the graph shown. If buyers
Q76: Given the equations for demand and supply:
Q114: Say that an economic model concludes that
Q142: Private property rights:<br>A)are essential elements of a
Q146: The opportunity cost of undertaking an activity