Refer to the graphs shown. The effect of increased consumer income and higher production costs on a normal good is most likely shown in: 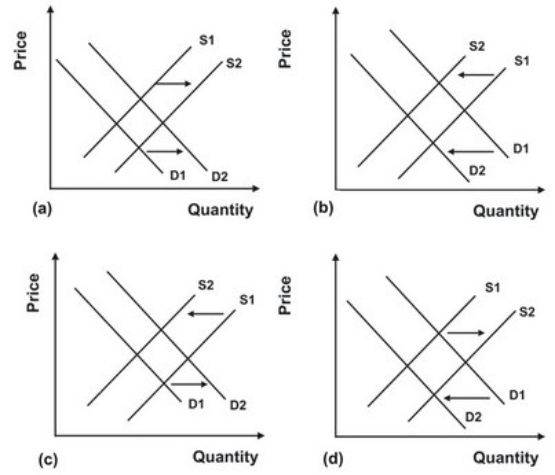
Definitions:
Confidence Level
The probability that a statistical result is not due to chance, often expressed as a percentage.
Accuracy Level
The degree to which the result of a measurement, calculation, or specification conforms to the correct value or standard.
Sample Size
The number of observations or individuals taken from a population for the purpose of statistical analysis.
Q1: If the supply of a product is
Q5: People can reasonably expect that an economic
Q17: According to the law of demand an
Q40: An increase in the Federal minimum wage,
Q53: Socialism in theory is an economic system
Q55: For complements:<br>A)cross-price elasticity of demand is negative.<br>B)cross-price
Q57: If an economist observed that higher hot
Q61: Refer to the following graph. <img src="https://d2lvgg3v3hfg70.cloudfront.net/TB7143/.jpg"
Q87: If macaroni and cheese is an inferior
Q119: Why does classroom attendance rise during exam