Refer to the graph below. 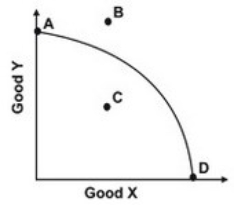 If the production possibility curve shifts along the Good Y axis, which point will remain as a point of efficiency?
Definitions:
Equilibrium Price
The price at which the quantity of a good demanded equals the quantity supplied, leading to market stability.
Equilibrium Quantity
The quantity of goods or services that is supplied and demanded at the equilibrium price.
Long Run
A period in which all factors of production and costs are variable, allowing for full adjustment to change.
Supply Curves
Graphical representations illustrating the relationship between the price of a good and the quantity of the good that producers are willing to supply.
Q11: A large percentage of the MDSs end
Q12: An economic model:<br>A)applies economic theory to understand
Q36: What is a natural experiment?
Q99: Why do marginal opportunity costs increase as
Q112: If the principle of increasing marginal opportunity
Q115: The model of supply and demand leads
Q116: The production possibility curves of two
Q140: Dogfighting is against the law in New
Q145: Which of the following is the best
Q161: Rent control makes apartments:<br>A)hard to find.<br>B)easy to