The following scatterplot represents the results of a study undertaken by Chakrabarty et al. (2005) who were investigating glutamate levels in psychotropic drug-naive OCD patients and comparing them with psychiatrically normal controls. Based on this scatterplot the following ANCOVA of glutamate levels in CSF was done. Findings were reported as follows for CSF glutamate levels in OCD patients compared to controls: F(1,29) =11.153, p=0.002. What conclusion can be drawn about this result? 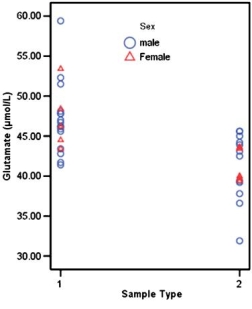 Scatterplot showing CSF glutamate levels in patients (1) and controls (2) . Source: http:/ / www.nature.com/ npp/ journal/ v30/ n9/ full/ 1300733a.html
ANCOVA of Glutamate Levels in CSF Diagnosis (OCD vs Controls) and gender were included as factors, while age, number of years of illness, total Y-BOCS scores, and CGI-S scores were included as covariates in the analysis.
Source: http:/ / www.nature.com/ npp/ journal/ v30/ n9/ full/ 1300733a.html
Definitions:
Q2: What is the definition of 'mean square''?<br>A)
Q4: When variances across groups are unequal, which
Q4: What is the purpose of the tourniquet?<br>A)
Q11: What are variables?<br>A)Variables estimate the centre of
Q15: A nosocomial infection is an infection _.<br>A)
Q17: If a doctor wishes to study the
Q25: A frequency distribution in which there are
Q28: The phrase "Black Power" emerged in the
Q32: Which of the following is a function
Q33: The murders of Tupac Shakur and Christopher