Multiple Choice
The following figure shows the impact of technological change on the marginal cost of producing a certain good.Producing Q* units with the new technology reduces total cost by an amount equal to ________. 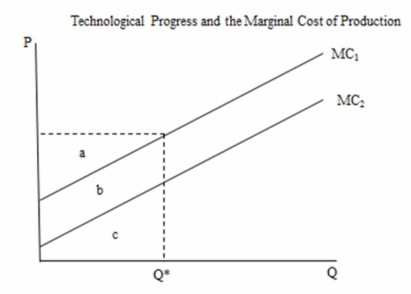
Definitions:
Related Questions
Q2: Estimating the value of environmental quality through
Q3: Controlling water pollution by establishing total maximum
Q7: A oil refinery plant has requested permission
Q16: Refer to the figure above.With government imposing
Q20: Refer to the figure above.In the graph
Q22: In Phase I of the Water Pollution
Q41: The EPA's CAP program for SO<sub>2</sub> gave
Q53: Which of the following terms is incorrectly
Q115: IQ tests were originally devised to help
Q125: An experimenter presents a CS followed by