Use the figure below to answer the following question(s) .
Figure 4-9 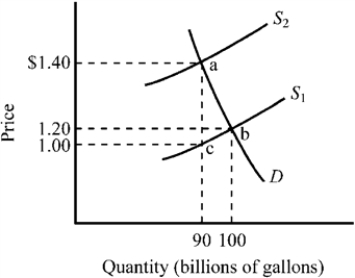
-Refer to Figure 4-9. The market for gasoline was initially in equilibrium at point b and a $.40 excise tax is illustrated. What does the triangular area abc represent?
Definitions:
After-Tax Income
The amount of income that remains after all taxes have been deducted.
Sales Tax
A tax levied by a government on the sale of goods and services, typically calculated as a percentage of the selling price.
Excise Taxes
Taxes imposed on specific goods, services, or activities, often used to discourage consumption of certain items or to raise revenue for targeted purposes.
Consumption Taxes
Taxes imposed on spending on goods and services, such as sales tax or Value Added Tax (VAT).
Q3: Which of the following is true regarding
Q47: Refer to Figure 4-13. The exhibit illustrates
Q70: After the terrorist attacks on September 11,
Q91: An important assumption that is made when
Q108: Because GDP does not fully account for
Q110: Other things constant, how will a decrease
Q136: If consumer tastes are changing more in
Q182: Which of the following is most likely
Q234: Assume that supply increases greatly and demand
Q250: The actual burden of a tax is