Use the figure below to answer the following question(s) .
Figure 4-12 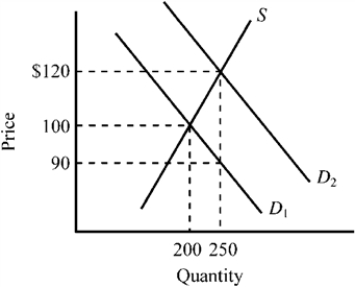
-Refer to Figure 4-12. The supply curve S and the demand curve D1 indicate initial conditions in the market for college textbooks. A new government program is implemented that grants students a $30 per textbook subsidy on every textbook they purchase, shifting the demand curve from D1 to D2. Which of the following is true for this subsidy given the information provided in the exhibit?
Definitions:
Market Price
The current exchange rate for an asset or service on the market.
Total Revenue
The total amount of money a firm receives from sales of its products or services.
Perfectly Competitive
A market structure characterized by a large number of small firms, homogeneous products, free entry and exit, and perfect information, leading to an efficient allocation of resources.
Market Price
The ongoing price for acquiring or disposing of goods or services in a market setting.
Q20: A firm purchases $400,000 worth of raw
Q52: A decrease in the dollar price of
Q57: A shortage occurs whenever<br>A)quantity demanded exceeds quantity
Q106: If the demand for a good is
Q126: Which of the following is true for
Q133: Refer to Figure 4-24. The per unit
Q150: The price of dishwashers increases dramatically, causing
Q162: In a typical college town, when students
Q170: Which of the following would contribute to
Q315: When economists say the quantity demanded of