Use the figure below to answer the following question(s) .
Figure 4-12 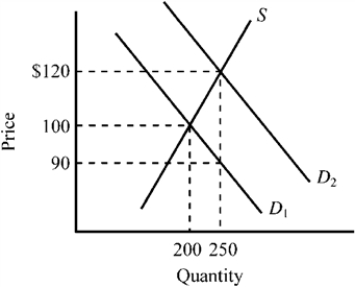
-Refer to Figure 4-12. The supply curve S and the demand curve D1 indicate initial conditions in the market for college textbooks. A new government program is implemented that grants students a $30 per textbook subsidy on every textbook they purchase, shifting the demand curve from D1 to D2. Which of the following is true for this subsidy given the information provided in the exhibit?
Definitions:
Q10: If a household has $40,000 in taxable
Q11: When adjusting nominal GDP for price changes,
Q29: To be economically successful, the entrepreneur must<br>A)combine
Q38: Jim values his car at $2,000, and
Q72: Melanie decided to sleep in today rather
Q143: Between 1994 and 2004, the monthly charge
Q178: Which of the following would increase the
Q179: Between 1991 and 2008, the federal minimum
Q211: GDP will tend to overstate the productive
Q278: Refer to Figure 3-13. The market for