Use the figure below to answer the following question(s) .
Figure 3-3 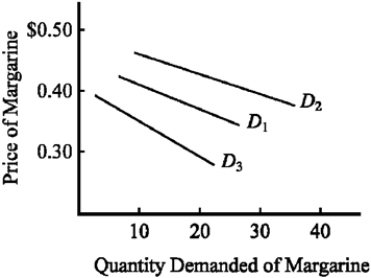
-In Figure 3-3, if the initial demand for margarine were D1, the impact of an increase in the price of margarine from $0.35 to $0.40 per pound on consumer purchases would be illustrated as
Definitions:
Labor Rate Variance
The difference between the actual cost of labor and the expected (or standard) cost, based on hours worked and pay rates.
Labor Efficiency Variance
The variance between the actual number of labor hours utilized and the anticipated standard labor hours for the achieved production volume.
Raw Materials Inventory
The stock of materials on hand that are used in the manufacturing process to produce goods.
Transaction (b)
Likely refers to a specific, numbered transaction within a set of financial records or accounting entries, without additional context provided.
Q3: Gross domestic product<br>A)is the sum of all
Q38: Jim values his car at $2,000, and
Q49: Graphically, the area that represents the difference
Q67: In economics, the term for a person
Q95: Refer to Figure 4-20. The amount of
Q97: Suppose you received a 5 percent increase
Q216: An income tax is defined as regressive
Q236: A tax for which the average tax
Q295: The price elasticity of demand for a
Q318: A decrease in the expected future price