Use the figure below to answer the following question(s) .
Figure 18-1 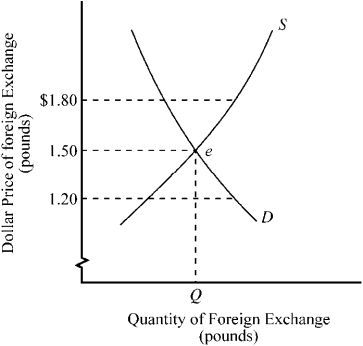
-Figure 18-1 illustrates supply and demand for U.S. dollars and British pounds in the foreign exchange market. If the dollar price of pounds is $1.20, which of the following is true?
Definitions:
Indifference Curve
a graph showing different combinations of two goods that give a consumer equal satisfaction and utility.
Budget Constraint
The limitations on the consumption choices of an individual or household due to limited financial resources.
MUx/MUy
Represents the marginal utility of good x divided by the marginal utility of good y, often used in consumer choice theory to analyze optimal consumption points.
Indifference Curve Analysis
A graphical representation of consumer preferences showing combinations of goods or services among which they are indifferent, demonstrating varying levels of utility.
Q7: Why did many economists during the 1960s
Q17: Which of the following is true regarding
Q21: Under the adaptive expectations hypothesis, how will
Q38: Which of the following is most important
Q39: Which of the following is a current
Q69: In Figure 17-3, in the absence of
Q89: Refer to Figure 17-8. If this country
Q113: Assume, for Canada, that the domestic price
Q200: What are the three basic questions faced
Q270: If air travel and bus travel are