Use the figure below to answer the following question(s) .
Figure 10-15 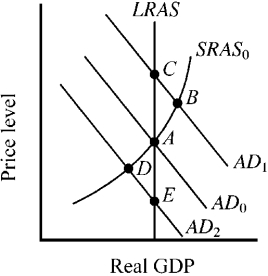
-The economy's short-run (SRAS ) and long-run (LRAS) aggregate supply curves are shown in Figure 10-15, along with three alternative aggregate demand curves and the accompanying equilibrium points. At which point will resource prices naturally tend to increase?
Definitions:
Q12: Given the aggregate demand and aggregate supply
Q38: If business decision makers expect that the
Q44: Suppose the population (age 16 and over)
Q58: Advocates of the crowding-out effect maintain that
Q68: The sale of government securities by the
Q76: During an economic contraction, housing and stock
Q95: Nicole has just finished high school and
Q101: As shown in Figure 10-18, the economy's
Q110: Which of the following is an example
Q201: Which of the following is the best