Use the figure below to answer the following questions.
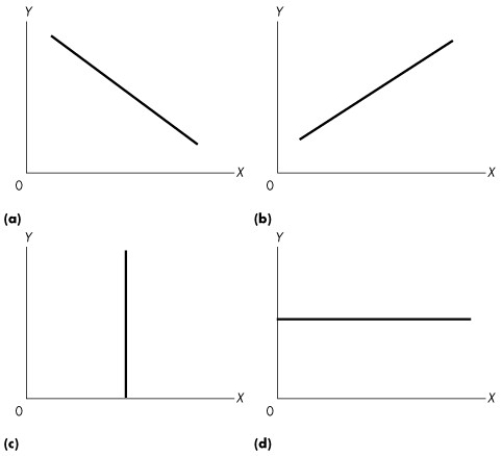
Figure 1A.2.3
-Refer to Figure 1A.2.3.If you were told that economic theory predicts that higher levels of the rate of interest (x) lead to lower levels of sales of houses (y) ,which graph would you pick to represent this economic relationship?
Definitions:
Measure of Variability
A statistic that describes the dispersion of data points in a dataset, such as range, variance, or standard deviation.
Parameter
A quantity that influences the outcome of a mathematical function or statistical operation, often a measure that describes a statistical population.
Measure of Central Tendency
A statistical measure that identifies a single value as representative of an entire distribution.
Parameter
A numerical characteristic or measure that describes an aspect of a population.
Q15: Which of the following is NOT one
Q18: Refer to Fact 3.5.1.A technological improvement lowers
Q68: Refer to Table 1A.3.3.When x equals 5,the
Q81: Economic growth _ overcome scarcity because _.<br>A)does;with
Q88: In Japan, the center firm in a
Q104: While both incremental and radical innovations can
Q109: Entrepreneurs tend to have all the following
Q127: If the equation of a straight line
Q129: Consider graph (d)of Figure 1A.1.5.Which one of
Q130: If Harold can increase production of good