Use the figure below to answer the following questions.
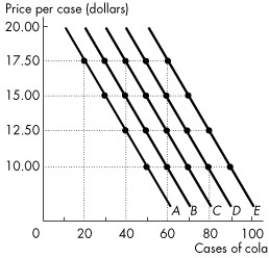
Figure 1A.4.5
-Consider the following information on cola sales by number of cases for a typical university residence floor: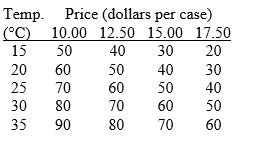
Refer to Figure 1A.4.5.Which one of the following represents what happens when the temperature rises from 20°C to 25°C?
Definitions:
Equilibrium Price
The price in the market where the amount of a product that consumers want to buy is the same as the amount available for sale, resulting in a balanced market situation.
Demand Schedules
Tabular representations showing the quantity of a good or service that consumers are willing and able to buy at various prices, over a specified period.
Surplus
In economics, the amount by which the quantity of a product exceeds the quantity demanded at a specific price.
Shortage
A market condition in which demand for a good or service exceeds the supply available at a specific price.
Q4: The economy illustrated by the data in
Q26: The essence of entrepreneurship is to capture
Q27: Suppose we observe a fall in the
Q44: _ are individuals, acting independently or as
Q50: In Figure 2.2.1,when 2,000 bicycles are produced
Q93: Refer to Table 3.5.2.A premature frost destroys
Q112: Initially,the demand curve for good A is
Q117: Intellectual property _.<br>A)includes land and buildings<br>B)includes stocks
Q136: Acquisitions are a low risk approach to
Q181: Before starring as Tony Stark in Iron